In the world of sports gambling, information is the ultimate currency. While most novice bettors spend their time analyzing player stats or weather reports, professional “sharps” are looking at something entirely different: the market itself. One of the most powerful tools for understanding market dynamics is public betting percentages.
These figures, often referred to as “betting splits,” reveal exactly where the crowd is putting its money. At Moneyline.fyi, we believe that understanding these numbers is the first step toward moving away from the “square” mentality and toward a more profitable, analytical approach.
The Anatomy of Public Betting Percentages and Money Splits
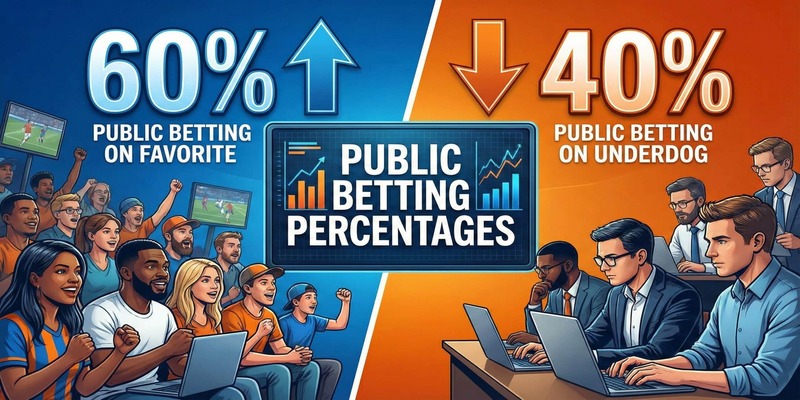
To use public betting percentages effectively, you must first understand what they represent. Most betting dashboards provide two distinct sets of data. The first is the “Ticket Percentage,” which tells you the raw number of bets placed on a specific side. The second, and often more important, is the “Money Percentage,” which reflects the total dollar amount wagered on that same side.
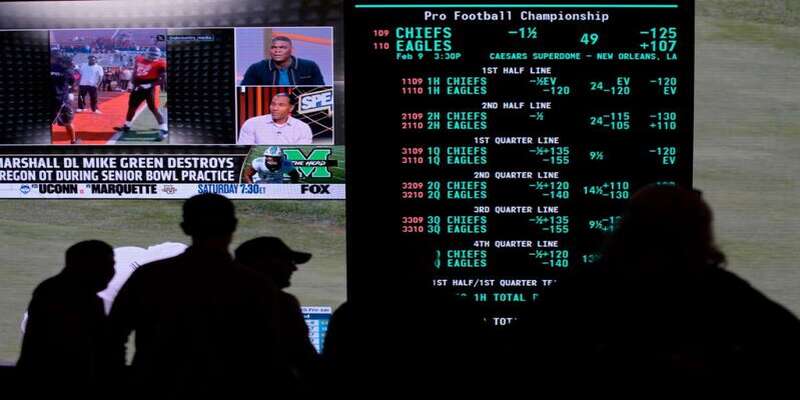
When you look at betting percentages, you are essentially looking at a heat map of public opinion. If 80% of the tickets are on the Kansas City Chiefs, but only 50% of the money is on them, you have discovered a massive “split.” This discrepancy suggests that while the general public (the “squares”) is betting on the favorite in large numbers, the big-money bettors (the “sharps”) are backing the underdog.

Monitoring these public betting percentages allows you to see the battle between casual fans and professional syndicates in real-time.
Identifying the Public Team Through Betting Trends
Every slate of games has what insiders call a “public team.” These are typically high-profile franchises with star players—think the Lakers, Cowboys, or Yankees. Because of their popularity, betting percentages for these teams are almost always skewed. The average bettor tends to bet with their heart or based on the latest highlight reel. This creates a situation where the betting percentages become incredibly “lopsided,” often reaching 70% or 80% on the favorite.
When betting percentages reach these extreme levels, it creates an opportunity for the sportsbook to adjust the lines. Bookmakers aren’t necessarily trying to predict the score; they are trying to balance their risk. If the public betting percentages are too heavy on one side, the bookie will “shade” the line, making the favorite more expensive and the underdog more attractive. By identifying the “public team” through these percentages, you can avoid paying a “public tax” on your wagers and start looking for value where the crowd is afraid to go.
Leveraging Public Betting Percentages to Spot Reverse Line Movement
The holy grail of market analysis is “Reverse Line Movement” (RLM). This phenomenon occurs when the line moves in the opposite direction of the public betting percentages. For example, imagine 75% of bettors are backing the Buffalo Bills at -7, but the line suddenly drops to -6.5 or -6. Why would a sportsbook make the favorite cheaper when everyone is already betting on them?
The answer lies in the total handle. When the line moves against the betting percentages, it is a clear signal that “sharp money” has entered the market. The professionals have placed such large wagers on the underdog that the bookmaker is forced to adjust the line to mitigate their liability, despite what the general public is doing.
Tracking betting percentages is the only way to spot RLM. It allows you to “fade the public” and align yourself with the most respected bettors in the industry. It’s a classic case of following the “smart money” rather than the “loud money.”
The Risks of Blindly Fading Betting Percentages
While “fading the public” is a popular strategy, it is not a magic formula for success. It is a common mistake to assume that the public is always wrong. Sometimes, the crowd is right. If a superstar quarterback is ruled out ten minutes before kickoff, the public betting percentages will naturally surge toward the opponent. In this case, the public isn’t being “square”; they are simply reacting to obvious news.
A deep analysis of betting percentages requires context. You must ask why the public is leaning a certain way. Are the betting percentages high because of a bias toward a famous brand? Or is it because of a legitimate mismatch on the field?
Blindly betting against high betting percentages without looking at the injury report or the tactical matchup is just as dangerous as following the crowd. The goal is to use these percentages as a starting point for your research, not as the sole reason for your bet.
Integrating Market Sentiment into Your Total Betting Strategy
To truly master the market, you must integrate public betting percentages into a broader strategic framework. Professional bettors use “power rankings” to determine what they think a line should be. They then look at the actual sportsbook line and the betting percentages to see where the market is overreacting. If your model says a team should be -4, but the public has driven the line to -6, you have found a 2-point value gap created by public hysteria.
Furthermore, betting percentages are highly volatile. They change as kickoff approaches and “limit-bet” professionals enter the fray. A smart strategy is to monitor how betting percentages evolve throughout the week. If you notice the money percentage rising much faster than the ticket percentage, it’s a sign that the pros are settling in.
By combining your own handicapping with an eagle eye on public betting percentages, you can wait for the optimal moment to place your bet, ensuring you get the best possible price before the market settles.
Conclusion: Winning the War Against the Consensus
Ultimately, sports betting is a marketplace, and like any market, it is driven by supply, demand, and emotion. Public betting percentages are the window through which we view those emotions. They reveal the biases, the fears, and the excitement of the betting public. For the disciplined bettor, these numbers are a map that points toward inflated lines and hidden value.
By analyzing betting percentages, spotting reverse line movement, and understanding when to fade the crowd, you stop being a gambler and start being a market analyst. Remember, the sportsbooks are built on the losses of the general public. If you want to end up on the winning side of the ledger, you cannot follow the same path as the 80%.
Use betting percentages to track the crowd, but use your logic to beat them. The numbers don’t lie, but they do require a keen eye to interpret. Stay sharp, watch the splits, and always look for the value that the public misses.